You may find yourself passionate about one issue or multiple issues. Transforming that passion into a coherent message often involves narrowing or broadening your focus, depending on whether you’re addressing too few or too many concerns. Authenticity is key, but you are building a winning coalition. The essence of candidate coalition building lies in fostering alliances among a diverse group of voters (with overlapping rather than identical priorities) in order that they will select you as their representative.
While Lore assumes a bid for a legislative seat, the insights provided can be tailored to county-level races as well. Regardless, it’s crucial to recognize the uniqueness of each district. Voter demographics, priorities, and concerns vary significantly.
State Senate and State House districts typically encompass a blend of local and statewide interests. Issues like transportation, city hood, and public safety exist alongside broader concerns such as the economy, education, healthcare, and agriculture. The electorate in a US House district further expands these interests to encompass national issues. What’s essential to understand is that these districts represent different levels of aggregation. A US House district encompasses around 500,000 voters, whereas a State Senate district encompasses about 125,000 voters, and a State House district about 40,000 voters. These numbers determine the prominence of purely local concerns in comparison to those that are more broadly shared. As the numbers increase, purely local concerns diminish in importance.
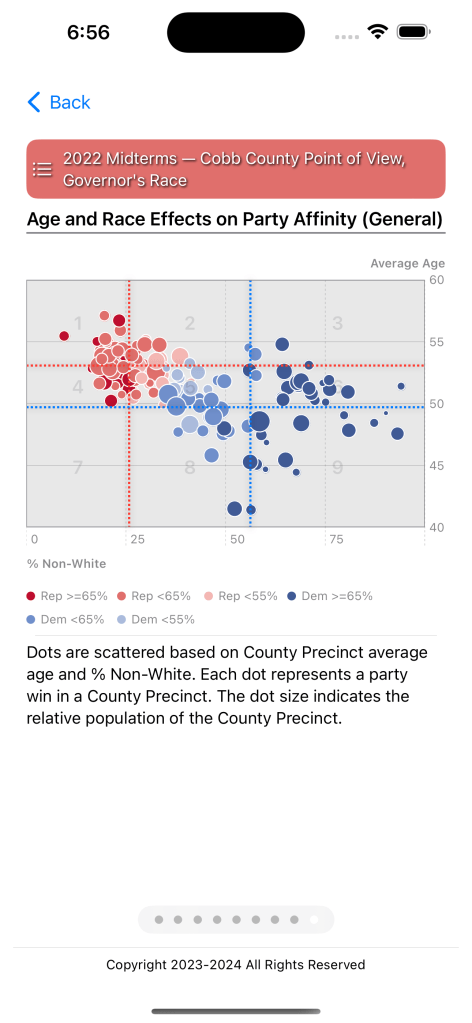
Summary demographic data as well as precinct level demographics offers valuable insights into your constituents’ makeup. It’s important, however, to recognize that demographics tell only a part of the story. They reveal historical trends. They don’t necessarily predict voter response in a given election cycle. What they do tell you is how voters are likely to respond to conventional party narratives.
In the scatter plot below, Lore visualizes how the percentage of non-white residents and average age in each precinct correlate with party affinity. In precincts with older, predominantly white populations, there’s often a stronger affinity for the Republican Party. However, as the proportion of non-white residents increases, the influence of age on party affinity diminishes. This underscores the interaction of demographic factors and political preference. It also emphasizes the need to account for these dynamics when shaping your message.
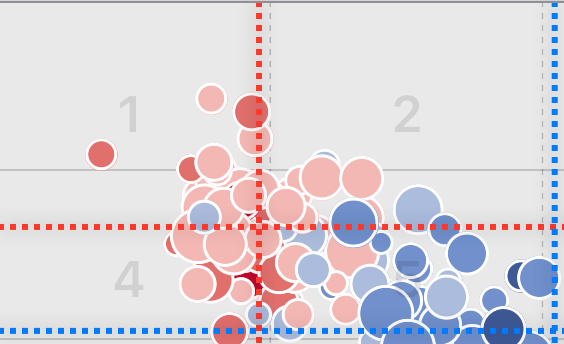
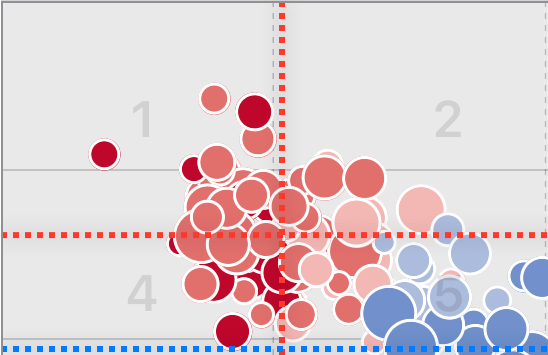
The importance of considering this interaction becomes abundantly clear when you compare measures of party affinity across contests. In the graphic below I compare the party affinity computed in Cobb County for both the US Senate and Governor’s contest. The graphic on the left (the US Senate Contest) shows a noticeably weaker affinity for the Republican Party than the graphic on the right (the Governor’s Contest). While incumbency plays a role, significant differences in affinity suggest the substantial influence of individual candidates and their narratives on electoral outcomes.
While Lore provides insights into the role of demographics in past elections, future outcomes in many districts hinge largely on candidate messaging and its alignment with voter priorities. Relying solely on conventional party narratives is fine unless the predictable result is defeat. In some districts, if you want to be competitive, it may be necessary to challenge or reshape the prevailing narrative of your party. In Part 2, I will discuss how Lore can help you navigate the differences between primary and general election demographics.

Leave a comment